Karvonus Agro
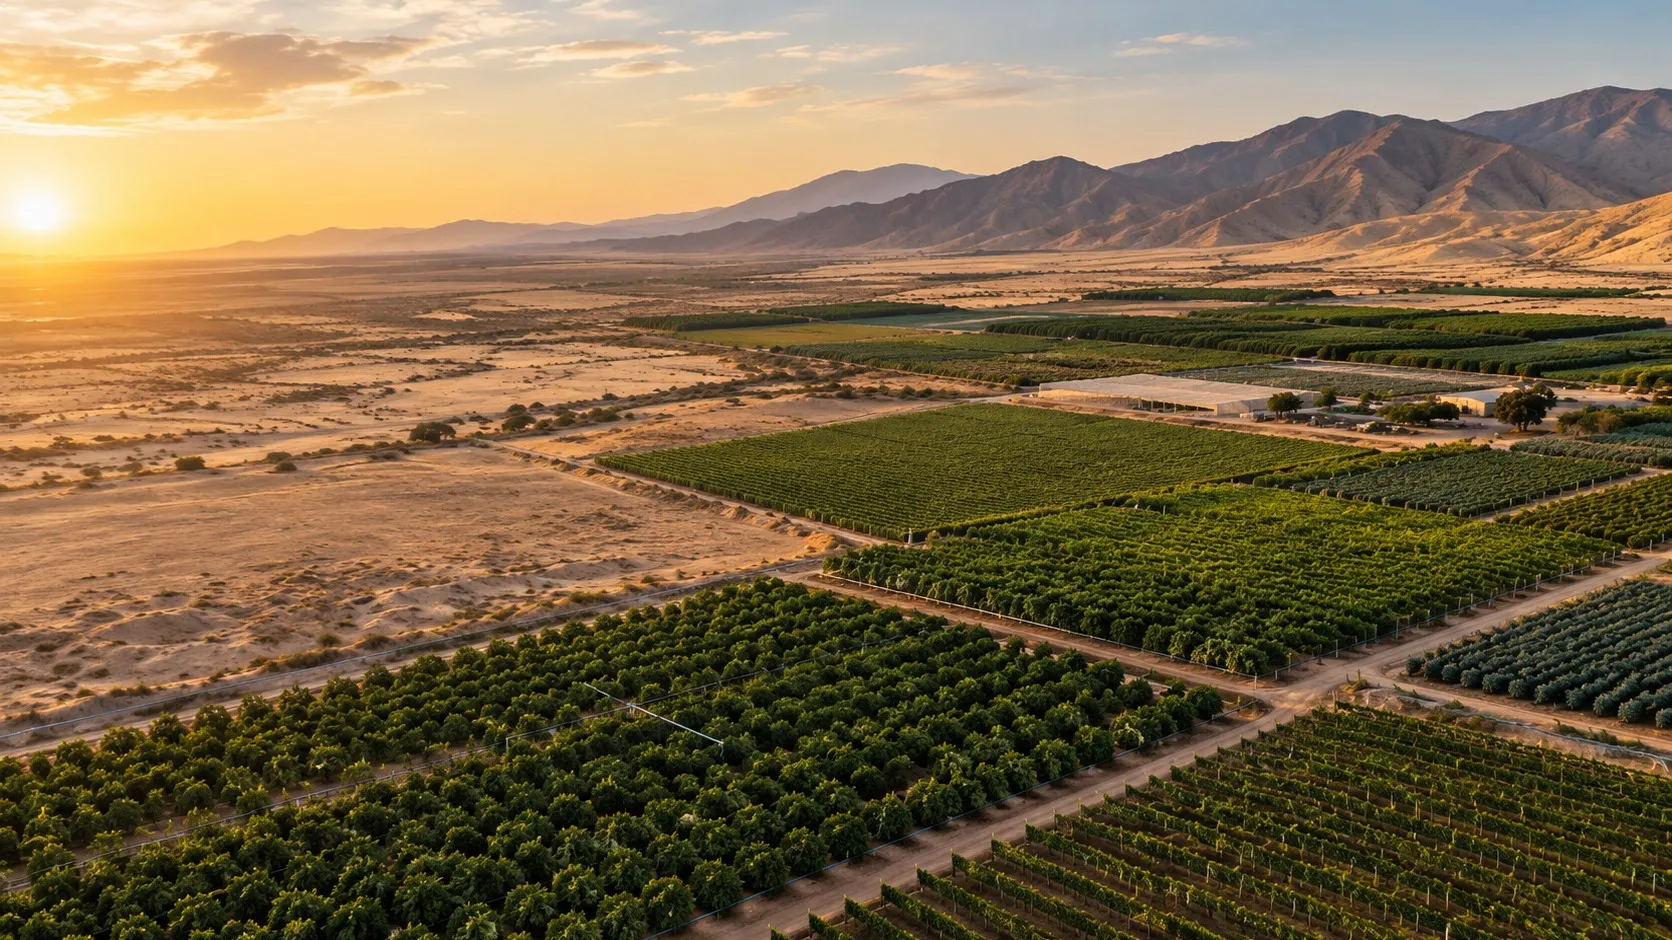
Your crops, read from space.
Satellite and weather data to look after your crops, produce more and earn from their carbon, lot by lot.
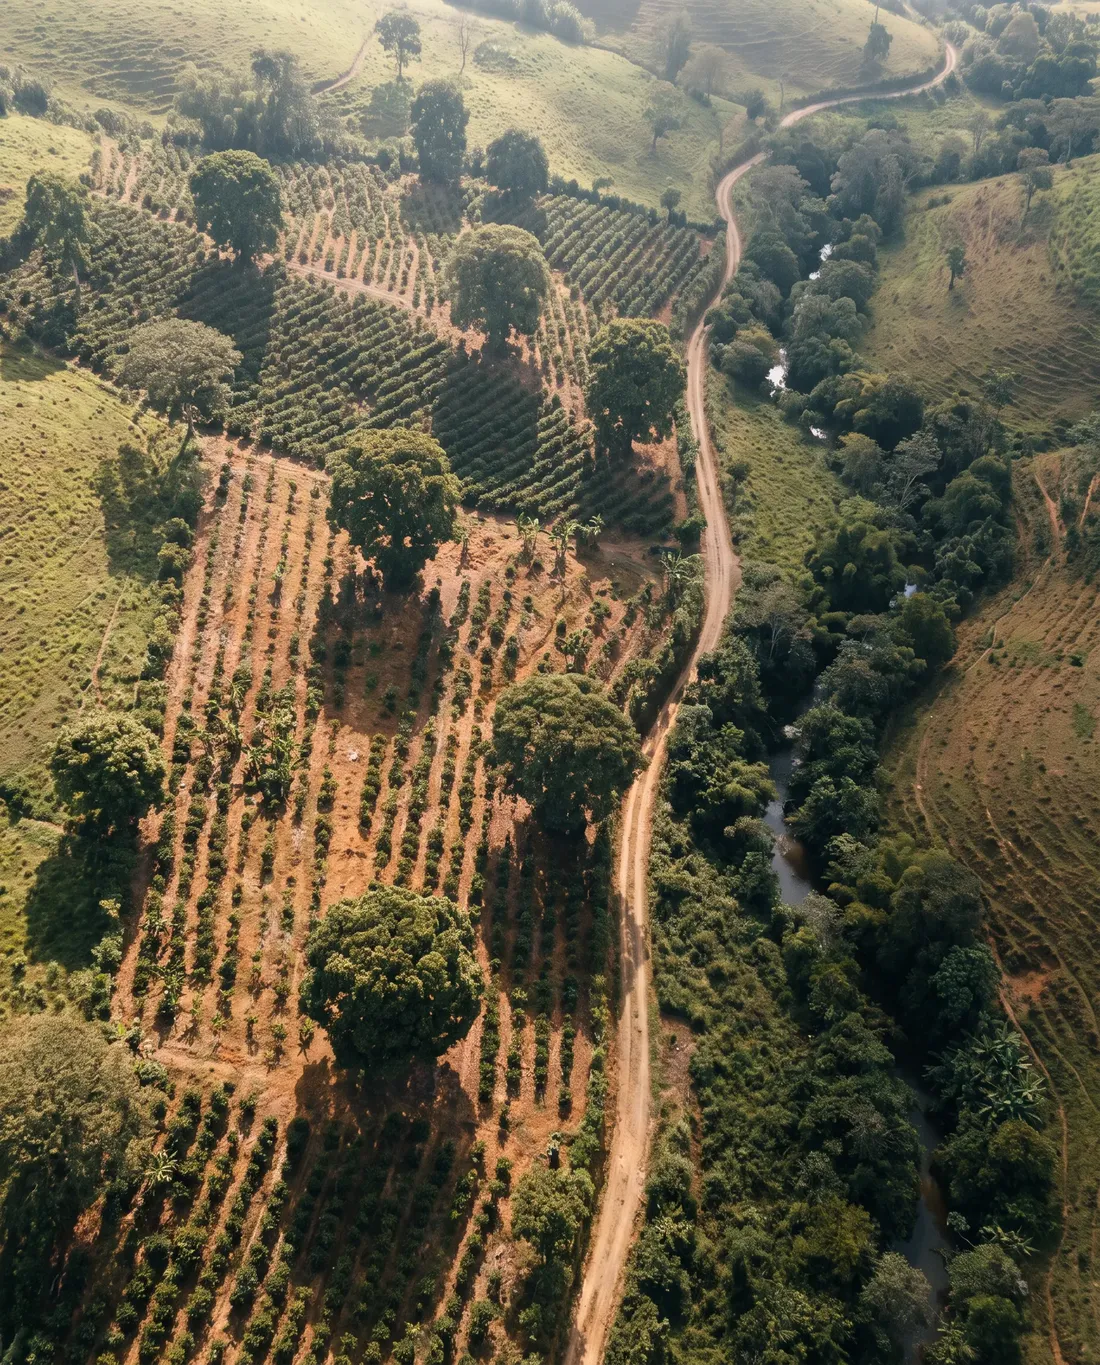
For whoever grows, and whoever backs them.
Farmers and growers
Know which lot needs attention before you walk the farm.
Agribusiness
Every property and crop on one map, comparable harvest after harvest.
Cooperatives and growers' associations
One shared reading of the state of your members' crops.
Agricultural insurers and lenders
The record of drought, frost and flooding of each property.
Data for every decision on your crops.
From looking after the crop every day to earning from its carbon. You switch on only the readings you need.
- 01
Protect the crop
Alerts to act before the damage arrives.
- Frost forecast up to 15 days ahead
- Hours with weather that favours pests and disease
- Drought and rainfall against the historical record
- Parts of the lot where water may be pooling
- 02
Produce more
Know which part of the lot yields less, and why.
- Crop vigour, compared with past harvests
- Chlorophyll signals to guide fertilisation
- Water stress and plant water use, to adjust irrigation
- Variability within the lot, bare soil and signs of salts
- 03
Earn from carbon
Turn good soil practices into carbon income.
- Estimated organic carbon in the soil
- Where it is worth sampling
- Preliminary carbon-credit scenarios
A satellite signal tells you where to look; the visit to the lot confirms what is happening.
Every lot, on one map.
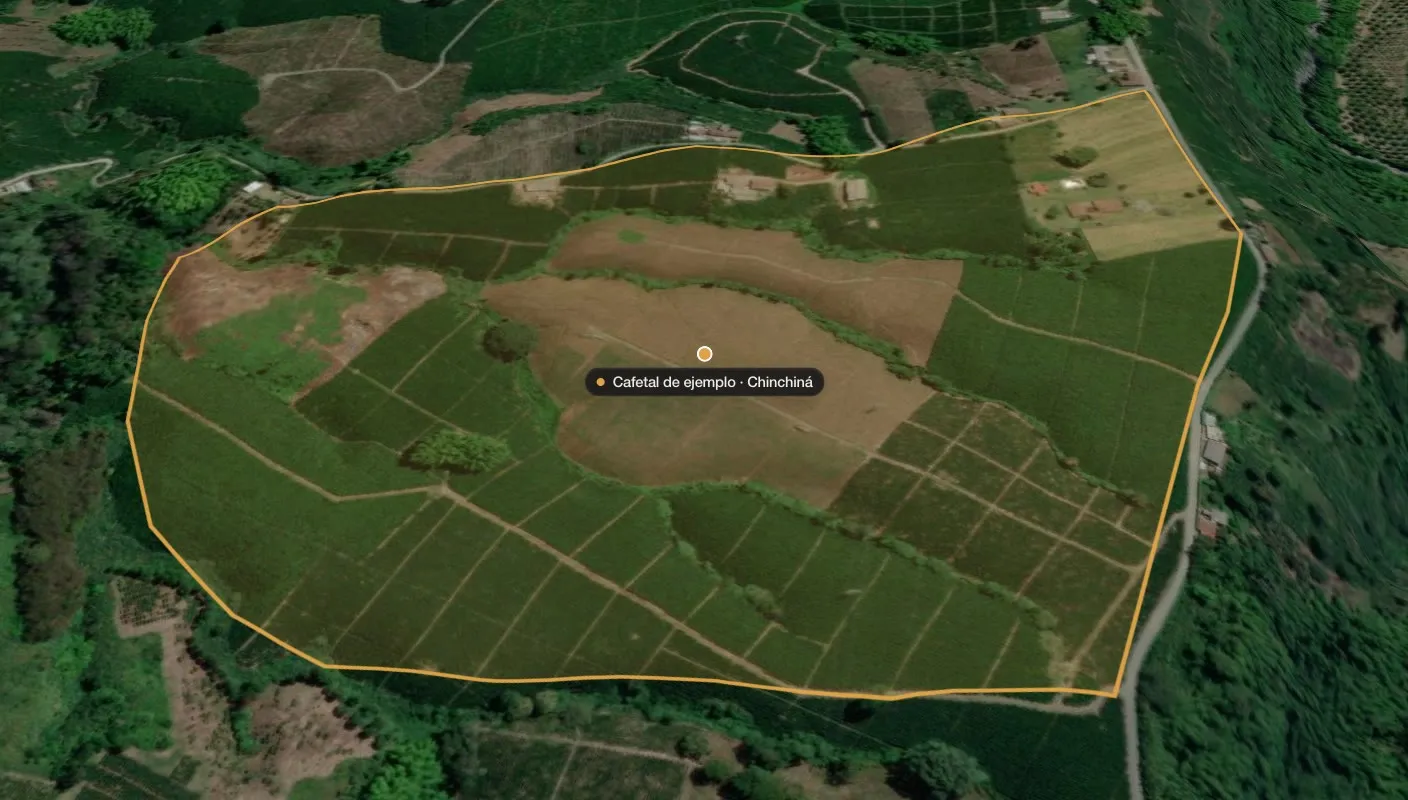
Draw your lots once. The platform brings together their history, keeps them up to date and warns you when something changes.
Getting started is simple.
- 01
Tell us what you grow and where
Share the location or the outline of your lots. No sensors, no equipment.
- 02
We read its history
Years of satellite images and weather records show how each lot has behaved.
- 03
Follow-up every month
Switch on only the readings you need, with alerts when something changes.
03 · Earn from carbon
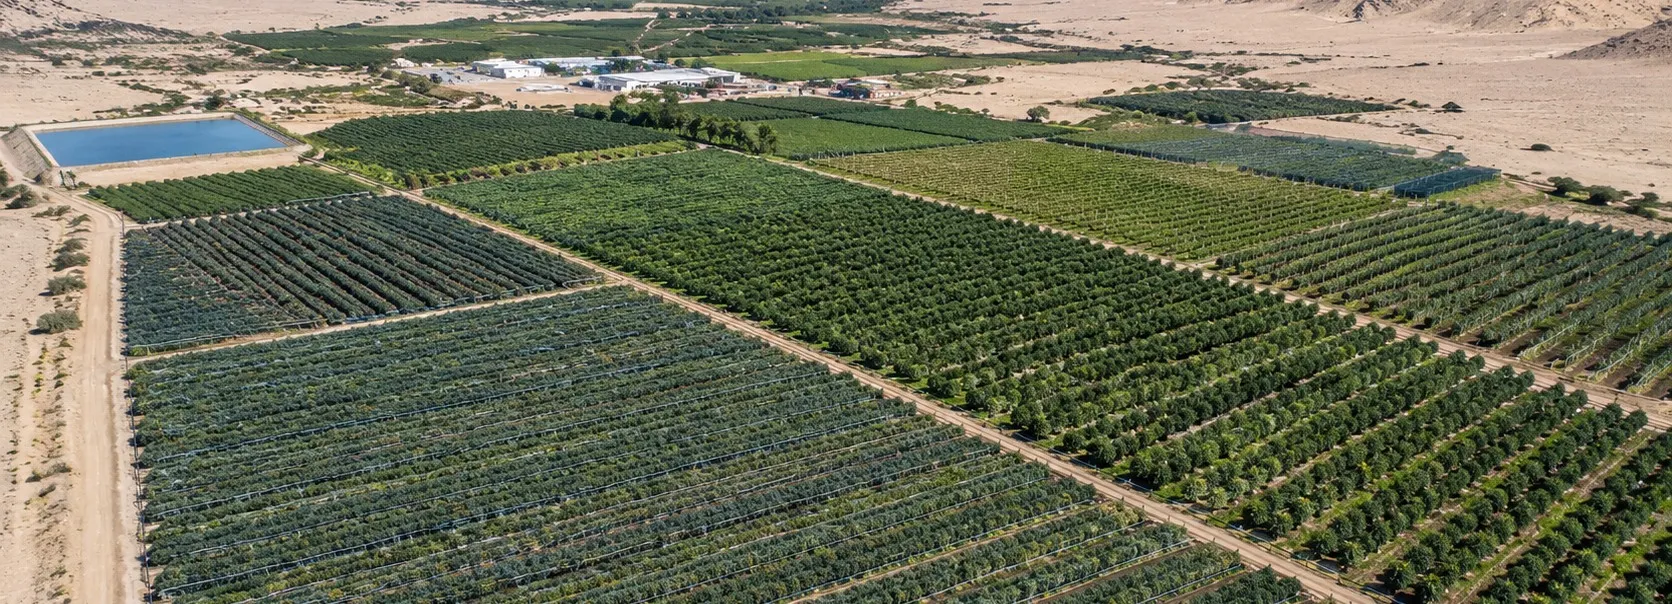
Could your farm soil earn carbon credits?
Good soil practices can store carbon. We give you a first assessment: how much carbon the soil holds today, where it is worth sampling and which credit scenarios are realistic.
An indicator is not an issued credit: we tell you what still has to be proven before promising any income.
Common questions.
See your crops on the map.
Tell us where they are and what you grow, and we show you what we can read of them today.